.png?type=webp)
10 DevTools tricks to help you with CSS and UX design
4 November, 2022
10
10
0
Contributors

DevTools, Mozilla Firefox users know it as Web Dev Tools, and the Microsoft Edge browser lovers would know it as Developer Tools. For the sake of simplicity, we will refer to all of them as DevTools in this article.Chrome Browser DevTools
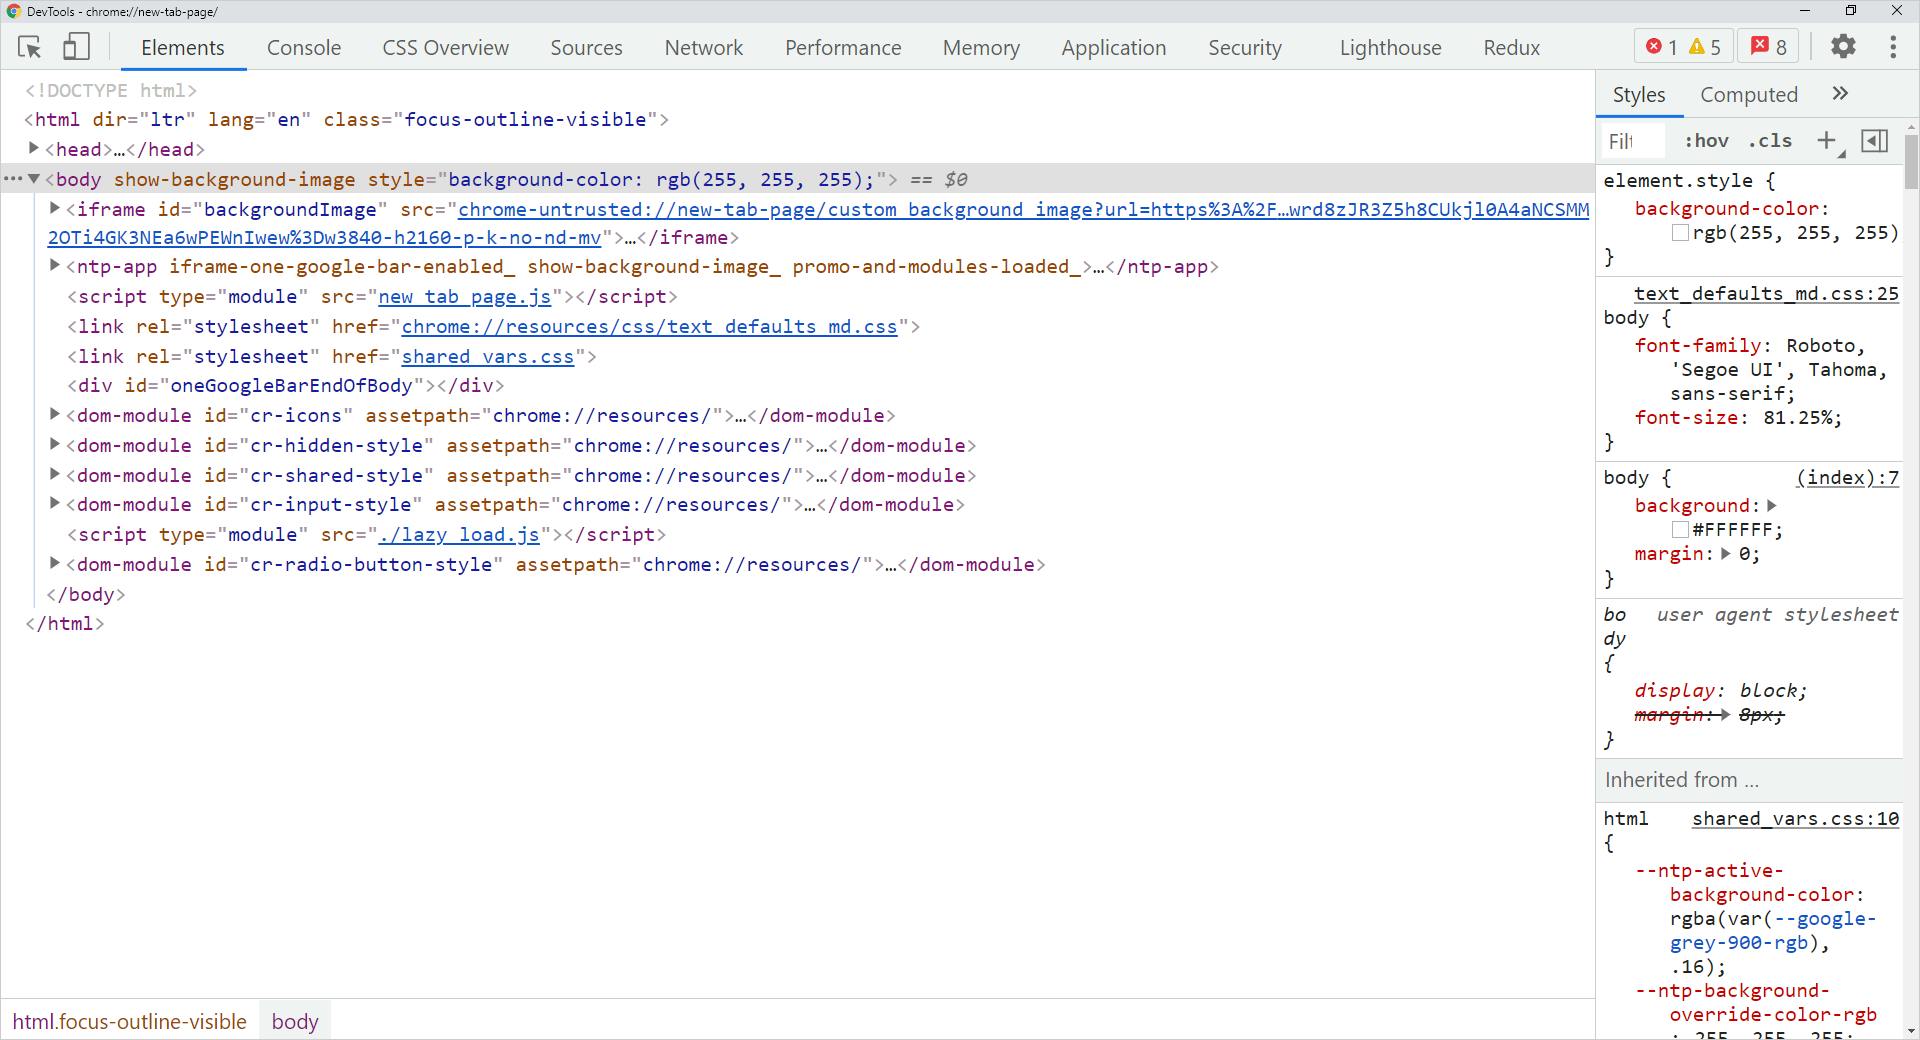
1. Turn the Design Mode "ON"
on to edit any texts on your website. It is convenient to test how dynamic content(like texts) may impact your layout. To enable it,•
DevTools and go to the Console tab.•
document.designMode = "on" and press the enter key.Figure 1.1: Design Mode On
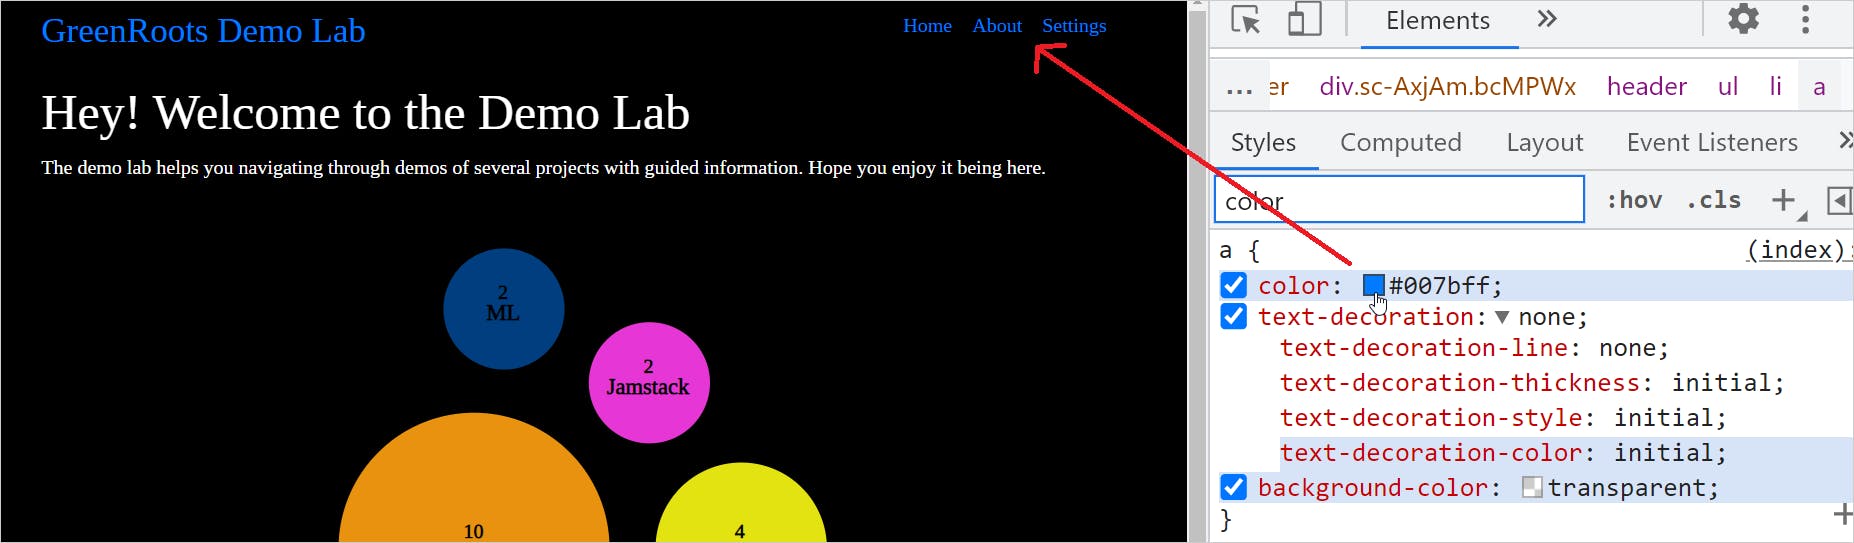
2. Color Picker
Color Picker is one of the most used tools in the DevTools set for web developers & designers. You can play with the color combinations, contrasts, accessibility all with this tool.Figure 2.1: Color Picker
1.
2.
Eye Dropper mode using the small dropper icon. The eye dropper mode helps you select a color from the document and use it elsewhere.3.
4.
Figure 2.2: Color Picker Sections
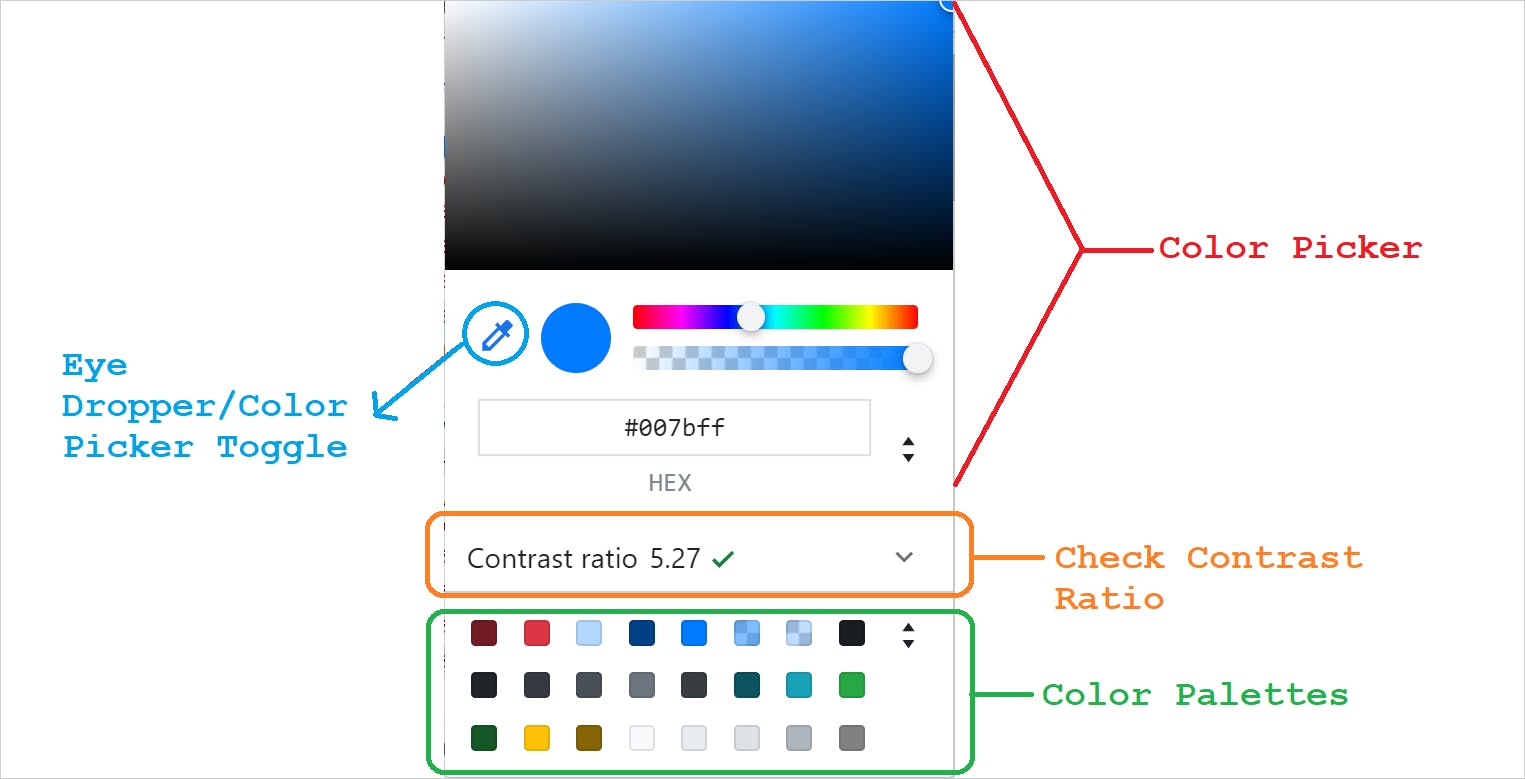
Figure 2.3: The Color Selector
Figure 2.4: Color Contrast Ratio
Eye Dropper mode is on, you can highlight and select the colors from the web page itself.Figure 2.5: The Eye Dropper Mode

3. Flexbox Editing and Debugging
Flexbox container to achieve the Flexbox module is ubiquitous in web design. The flexible layout is the easy answer for many of the layout issues we had earlier.Flexbox layout module has many properties that control the layout and position of the elements. The Google Chrome browser version 90 got us a super cool tool to edit and debug Flexbox properties.display: flex or display: inline-flex, you will get the flex badge near the element in the Elements panel. In addition, the Styles panel will show a new icon to open the Flexbox editor.Figure 3.1: The Flexbox Editor Icon
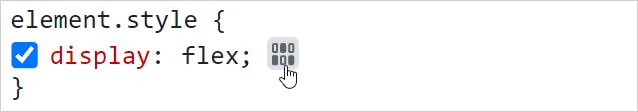
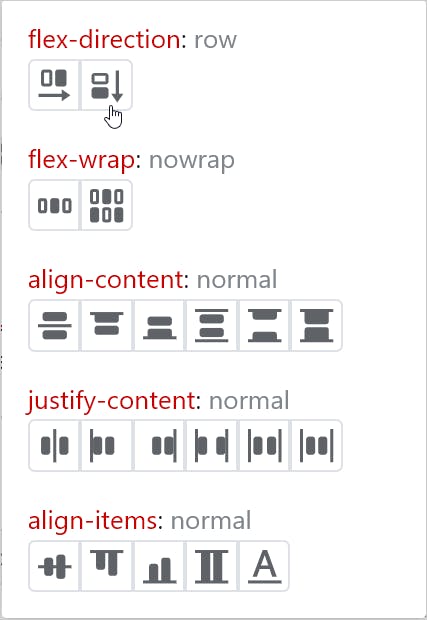
Figure 3.2: The Flexbox Editor
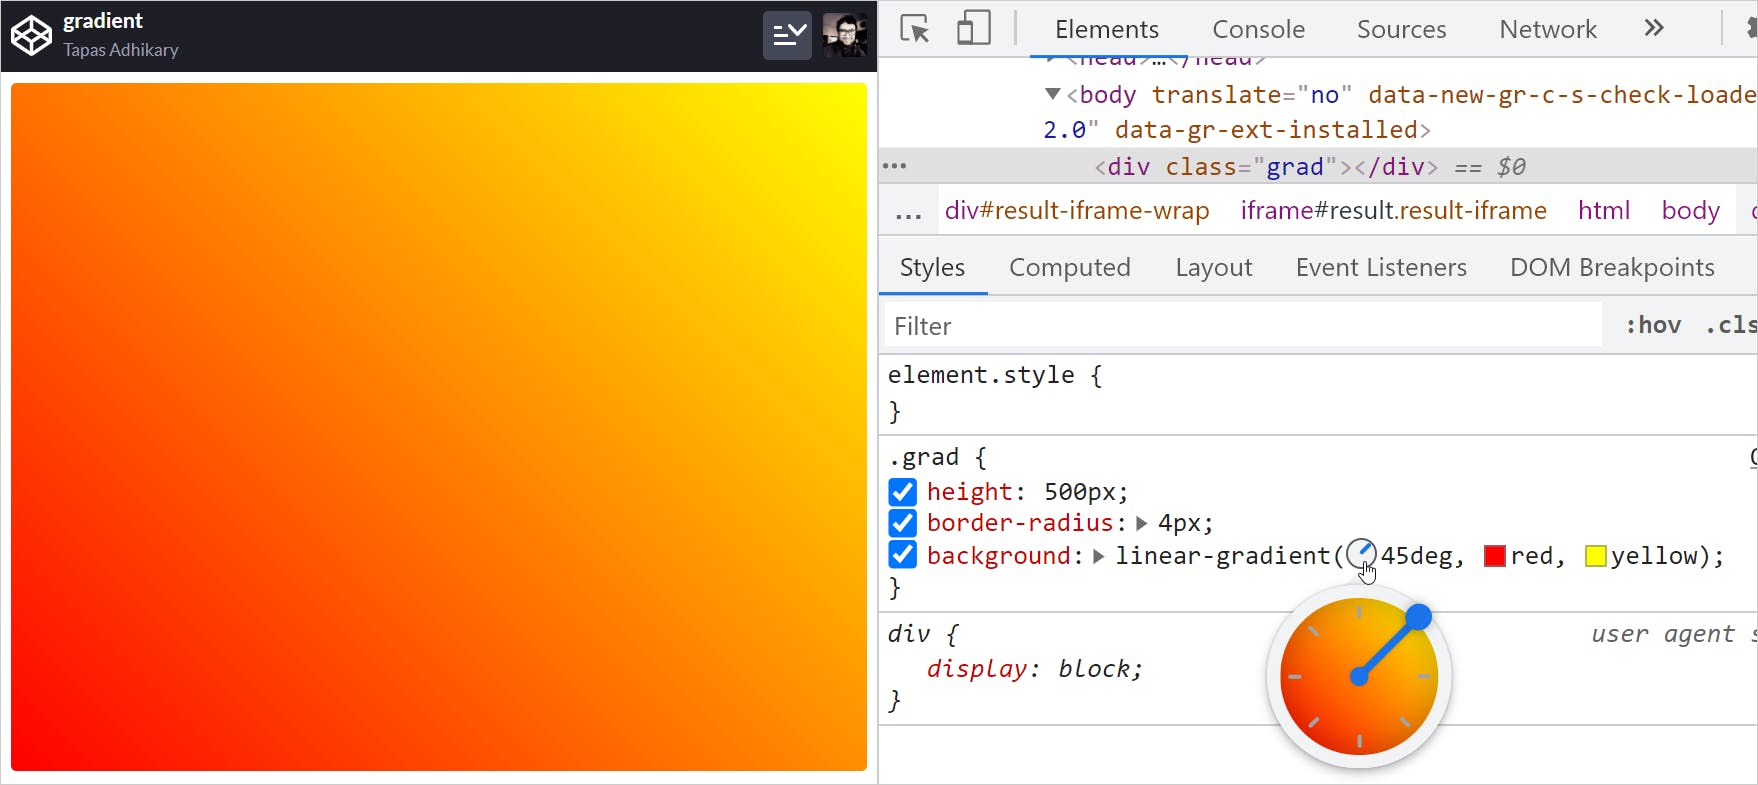
4. Gradient Selector
1.
2.
Devtools provides a Gradient Selector that helps you precisely with that. You can try and change the parameter values to get to your preferred gradient faster.Figure 4.1: The Gradient Selector
5. Clip-Path Editor
clip-path is a great way to create shapes of your choice. The clip-path property creates a clipping region to decide the part of the element to show. The area outside of the clipping region will be hidden. Here is an example of a rectangular polygon using the clip-path CSS property,Mozilla Firefox DevTools provides a clip-path editor to create the shape with a few drag and drop.Figure 5.1: Select the Clipped Area
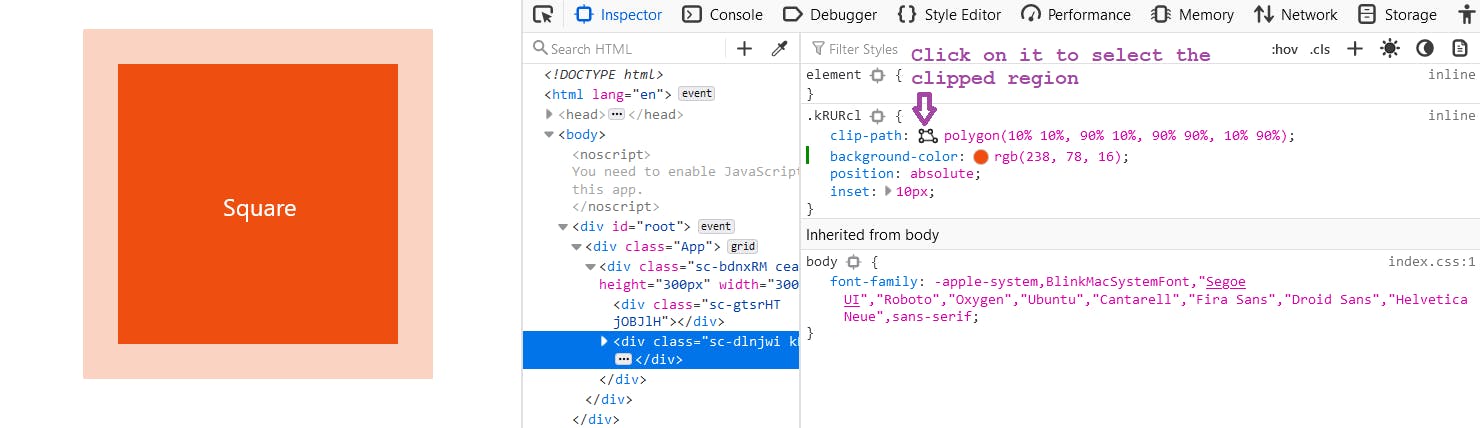
Figure 5.2: Clipped Area Selected
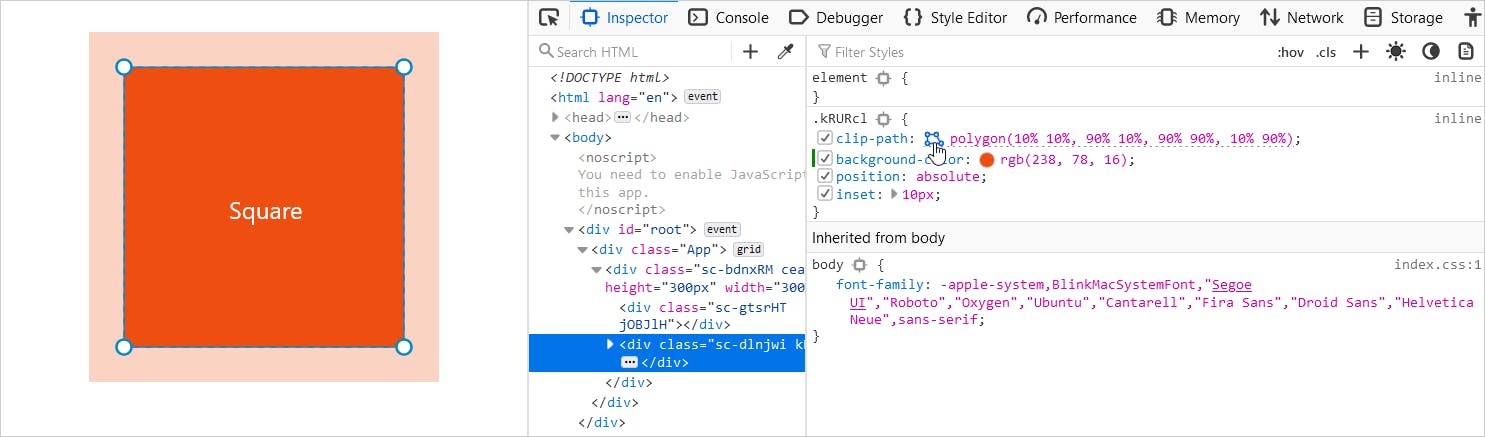
Figure 5.3: Adjust the Shape
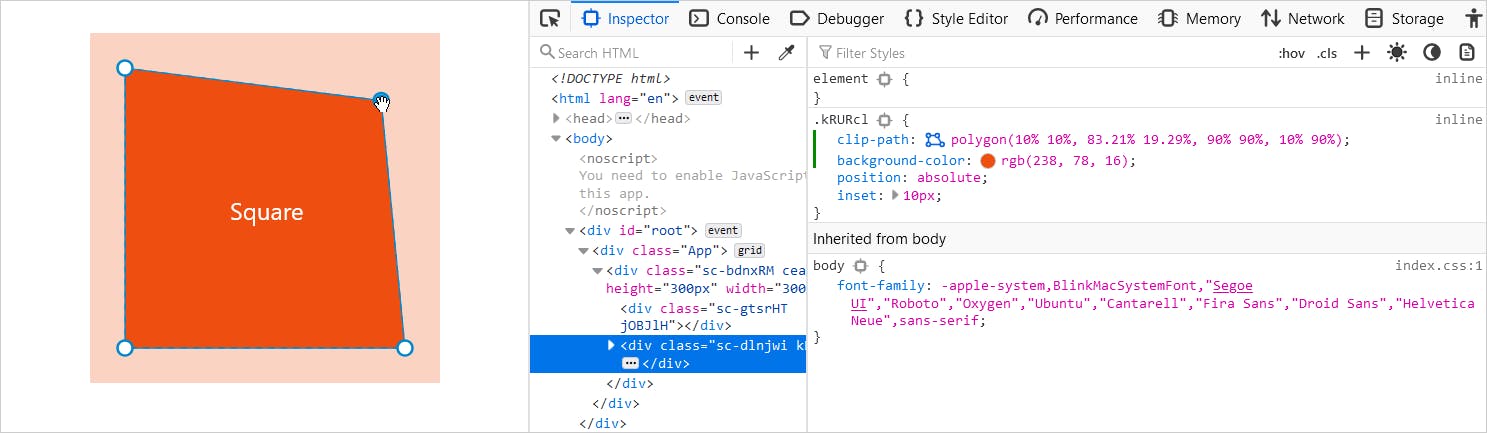
Figure 5.4: Clip-Path Editor Demo
6. CSS Overview
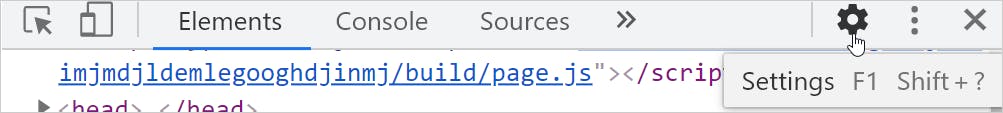
CSS Overview. Using this tool, you can gather information about the colors, fonts, unused declarations of styles, media queries of a web page in a single place. You can then make use of this information to copy any part of it and reuse it elsewhere.CSS Overview feature may not be enabled in your Chrome browser by default. To enable it, please click on the settings icon at the top-right corner of the DevTools interface.Figure 6.1: Click on the Settings Icon
Experiments option from the left side. It will list a set of experimental features that are not available to use by default. Next, please select CSS Overview by clicking on the checkbox beside it.Figure 6.2: Select the CSS Overview Feature
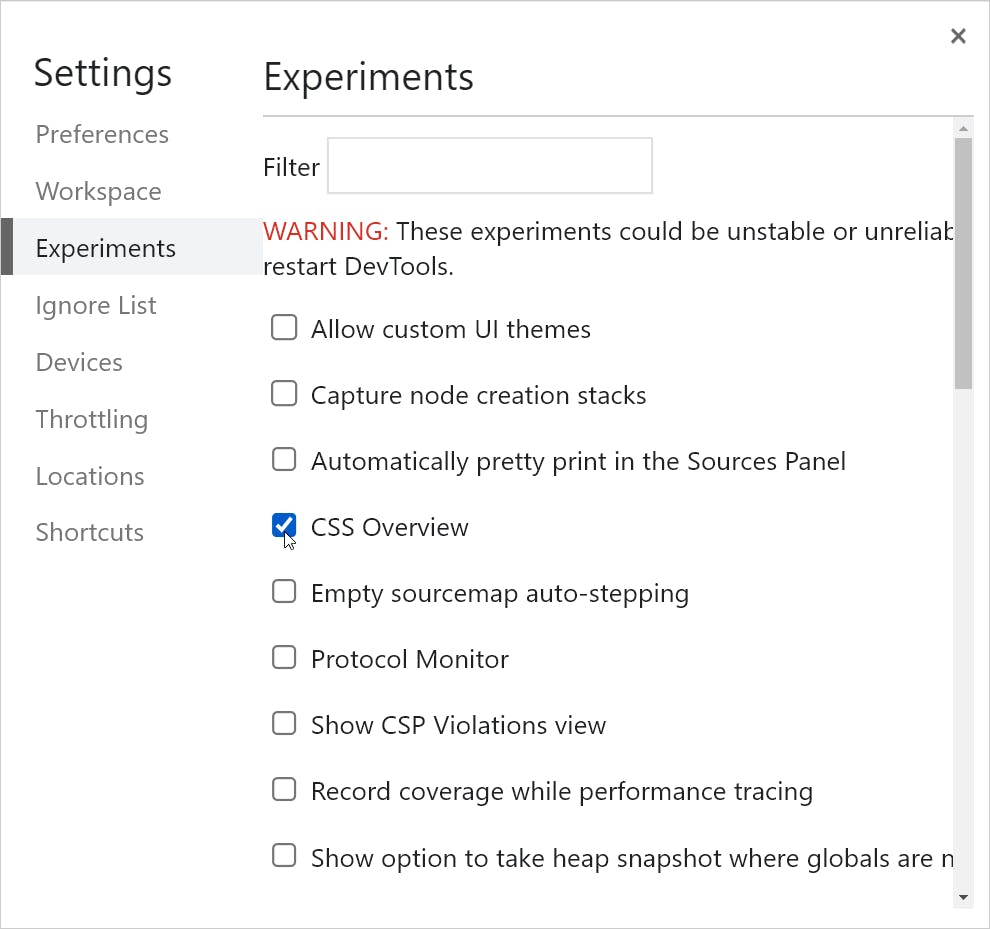
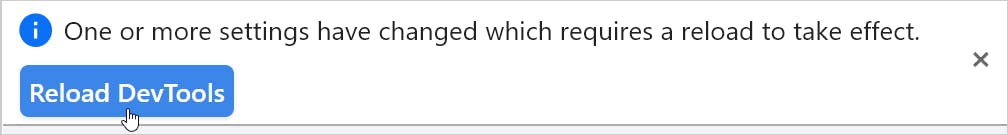
Figure 6.3: Reload DevTools
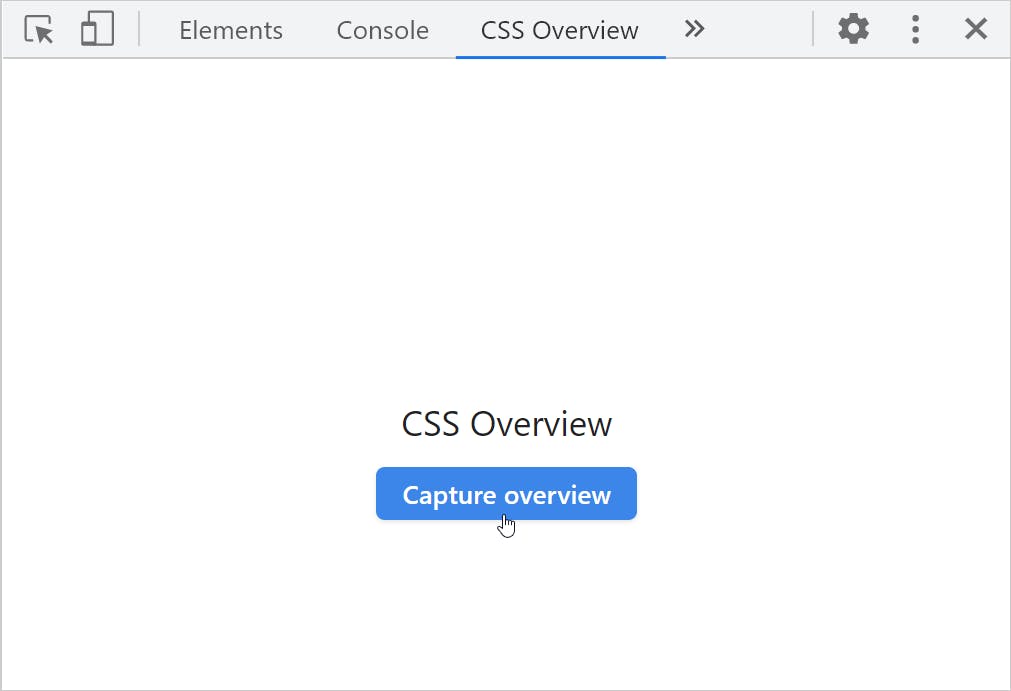
CSS Overview, beside the Console tab. Go to the CSS Overview and click on the Capture overview button.Figure 6.4: Capture Overview
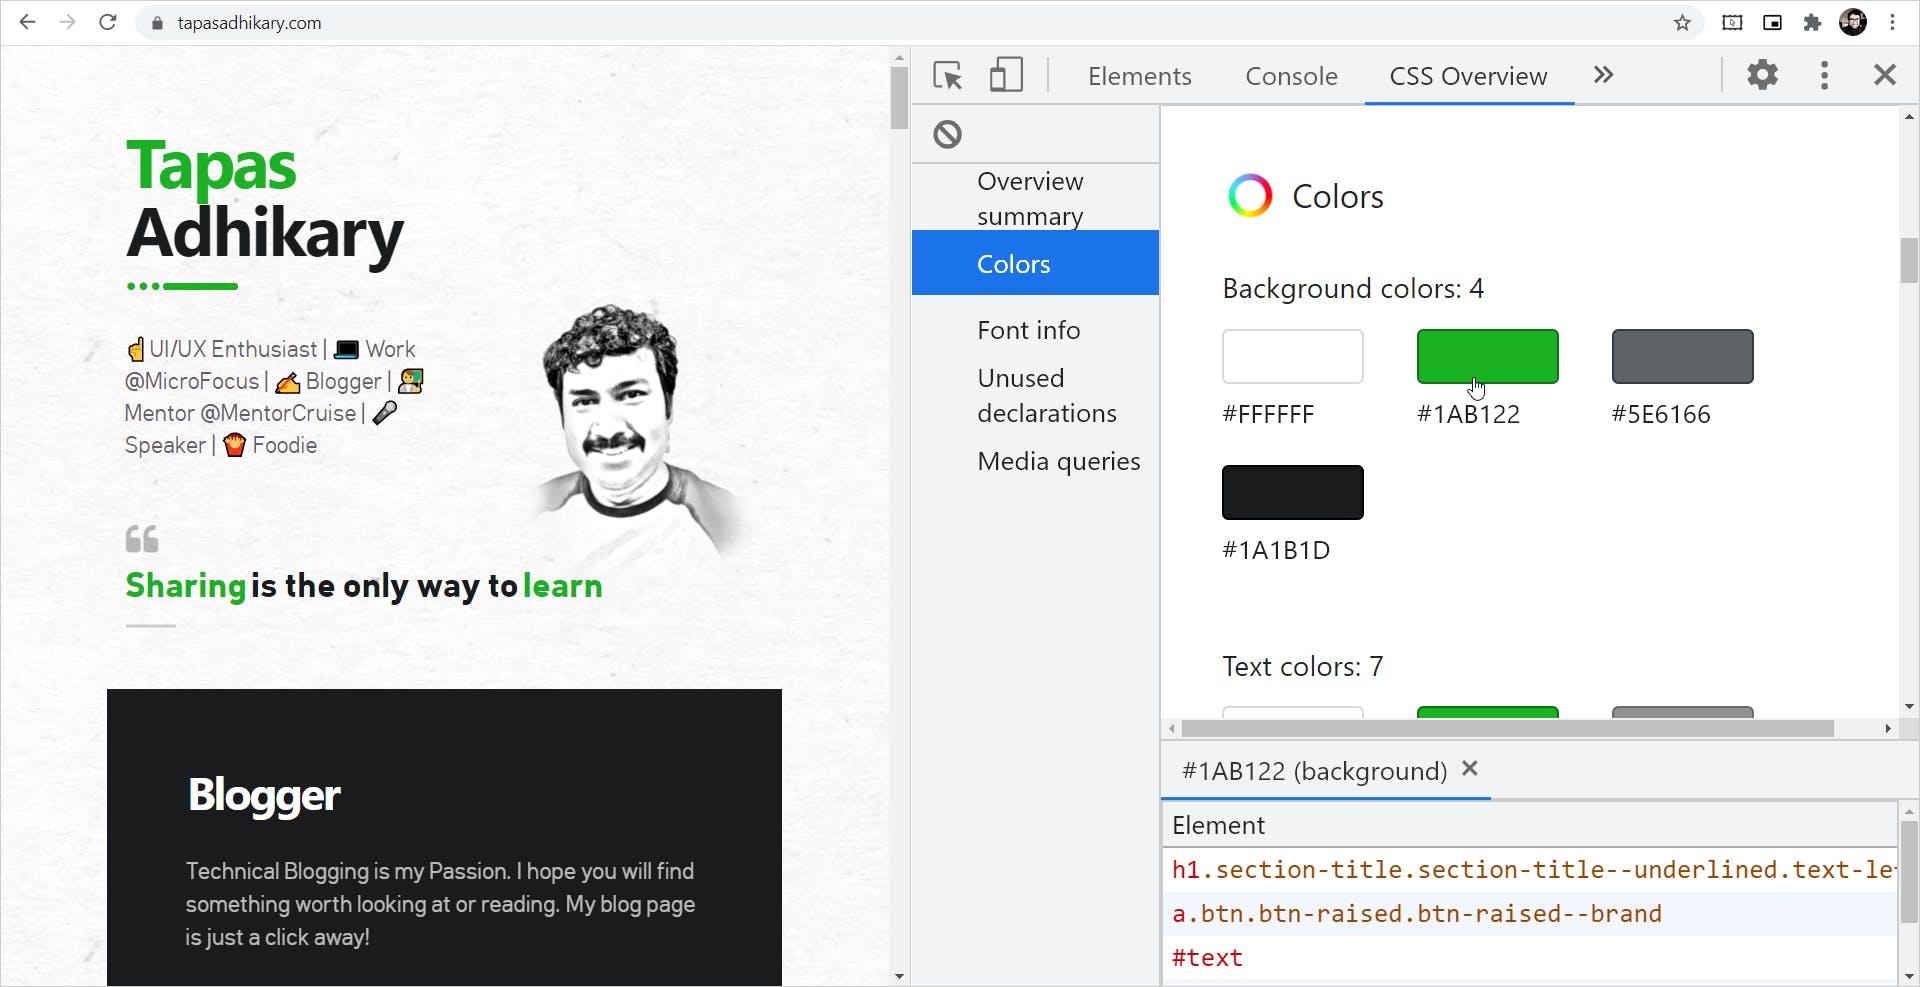
Colors information of my portfolio website. You can browse other information like the font info, unused declarations, and more.Figure 6.5: CSS Overview in Action
7. Font Editor
Font Editor tool provides you the control to adjust the font attributes. To open the font editor, please inspect an HTML element to edit the font properties. Then under the Inspector tab, you should find a sub-tab called Fonts.Figure 7.1: The Font Editor
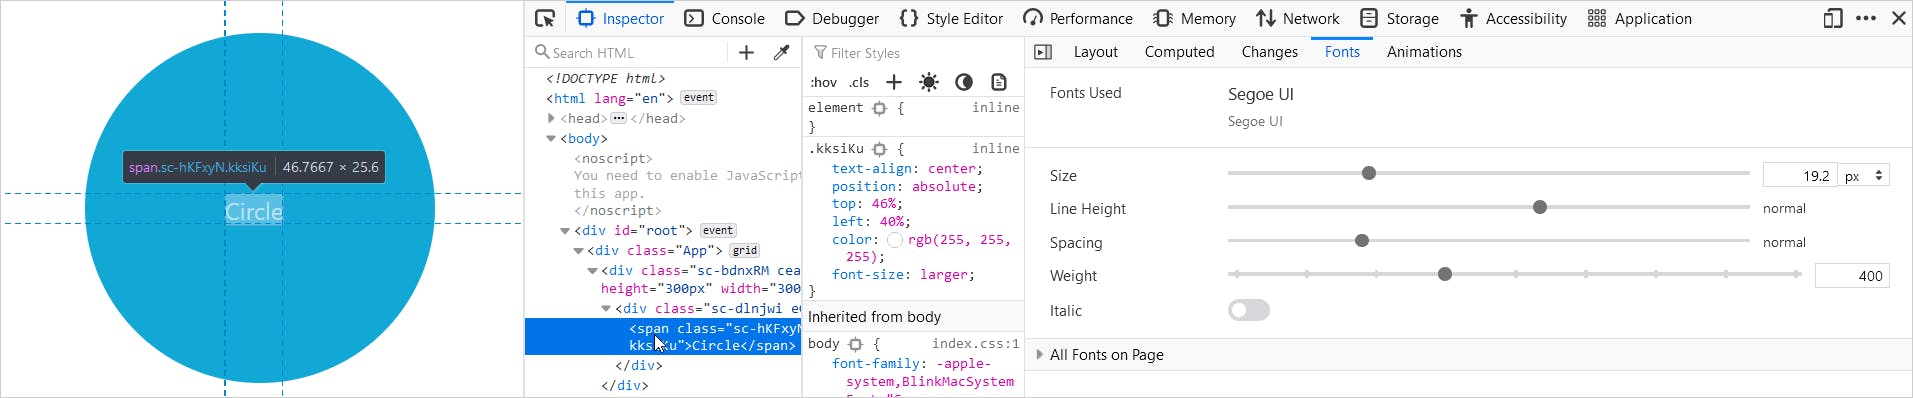
Figure 7.2: Adjust the Font Attributes
8. Changes
Changes tab. You can find it just before the Fonts tab we have seen above.Figure 8.1: Changes
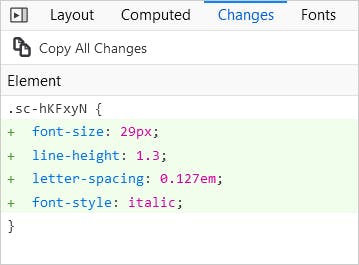
Changes tab to your source code editor.9. Animation Editor
Animations tool helps you with that. You will find the Animations sub-tab under the Inspector tab of Firefox DevTools.Figure 9.1: Animation Tool
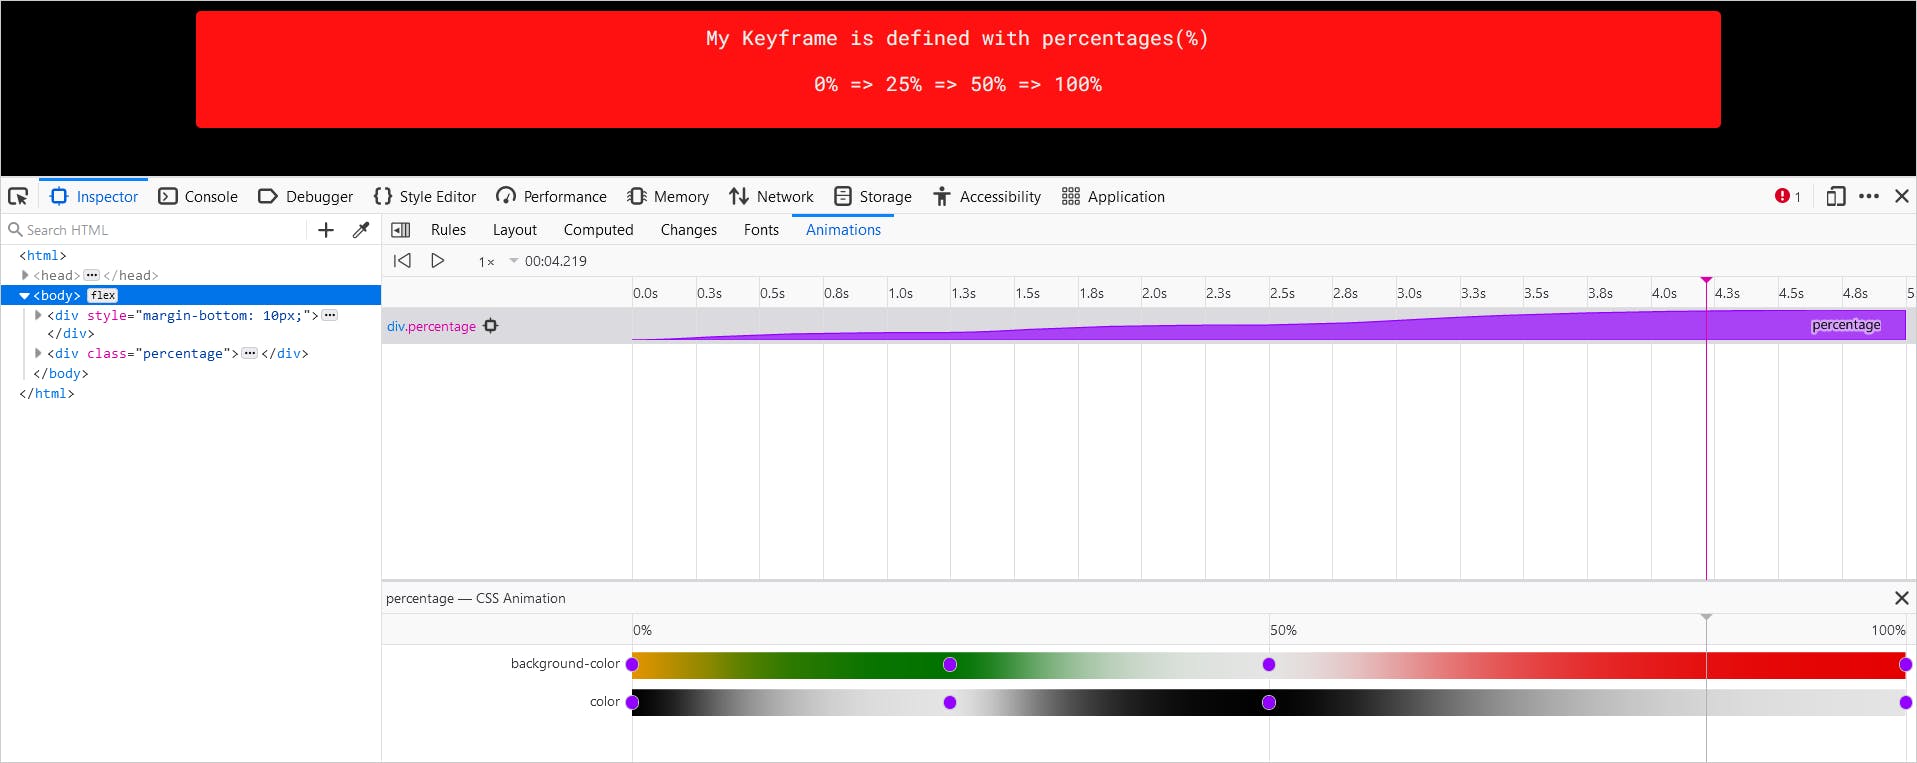
Figure 9.2: Animation by Time
Figure 9.3: Debug Animation
10. Device Toolbar
Device Toolbar is to help you with it.Device Toolbar by clicking on the icon beside the inspector icon.Figure 10.1: Toggle Device Toolbar
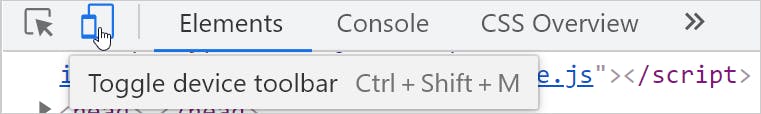
Figure 10.2: Test Responsiveness using the Device Toolbar
javascript
web
application
devopstools
development

